
Integration of FortiGate Firewall with Elasticsearch

As our main focus is to provide knowledge and help optimize data and event management, we continue our integrations using Elastic Agent. In the previous article, we demonstrated how to collect events from various Windows logging channels, with a focus on "Windows Firewall" and the identification of "Windows Events." Now, we're ready to take our integrations a step further by incorporating the FortiGate firewall with Elasticsearch using Elastic Agent.
FortiGate is a renowned security firewall widely adopted in enterprise environments to safeguard networks against cyber threats and attacks.
The integration of FortiGate with Elasticsearch will provide a more comprehensive view of your infrastructure's security, allowing you to effectively analyze and manage firewall-related events. This integration plays a critical role in gaining visibility and conducting effective analysis of the events and logs generated by these devices in our security network.
FortiGate devices offer a wide range of security features, including content filtering, intrusion detection and prevention, application control, among others, making their integration even more valuable. This enables us to maintain a global view of our security posture and take proactive measures to protect our assets. Additionally, the capability to store and analyze event logs in Elasticsearch facilitates security incident investigations, regulatory compliance, and continuous improvement of our security infrastructure.
To achieve this integration, we will follow the following steps:
To enable data collection from FortiGate and its transmission to Elasticsearch, it's essential to ensure that the collector you plan to use has Elastic Agent installed. If you don't have it installed yet, this article will guide you through the installation process.
This time, we will use a Linux server with the IP address 192.168.10.2, which will serve as our collector.
Next, we head to the FortiGate firewall to perform the necessary configuration. Once you have logged in to the device, go to the “Log & Report” section, and then select “log setting” In this section, we will proceed to configure the events that we want to send to Elasticsearch.


3. Within the “Log setting” section, we will specify which specific events we need to send to Elasticsearch. In this case, we will choose to enable all events.

It's important to remember that enabling all events can generate a large volume of logs, so it should be carefully considered whether it's necessary and whether there is enough capacity to manage and analyze all those logs.
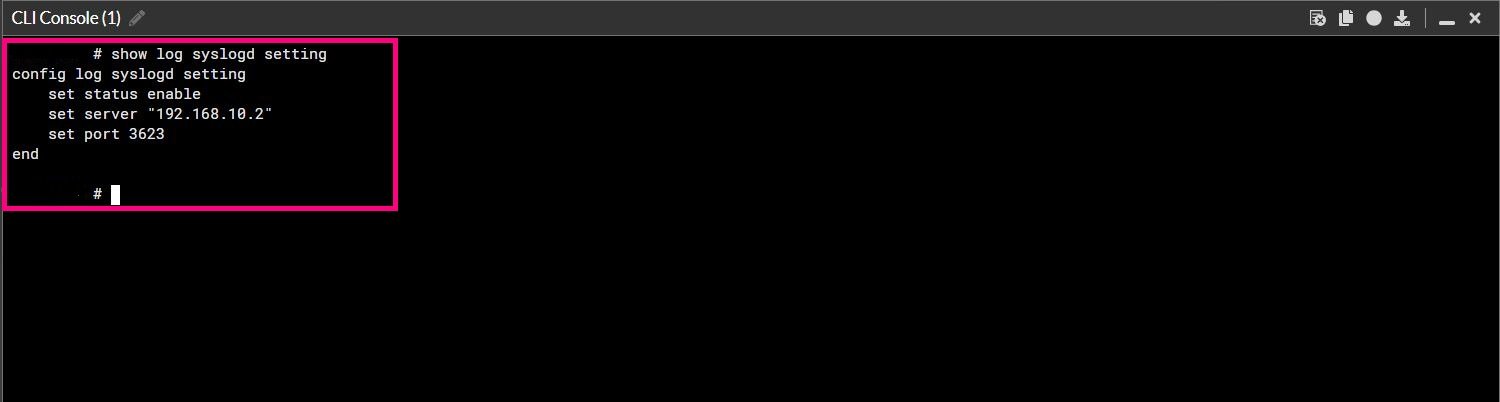
4. Now, to set up syslog, we first enable the “Syslog logging” option. Here, you should enter the IP address of your collector.

Normally, the default port for syslog is 514, but in this case, we are going to use a different port: 3623.
Customizing the port is an excellent practice, especially when managing multiple integrations with Syslog. By using different ports, you can avoid conflicts and streamline log management. This enables greater control and organization of your log data, which is essential for effective monitoring.
5. To do this, you will need to use the command line, as the graphical interface does not display the option to configure the port. Once you enter the IP address and adjust the port, you are ready to proceed with the configuration.

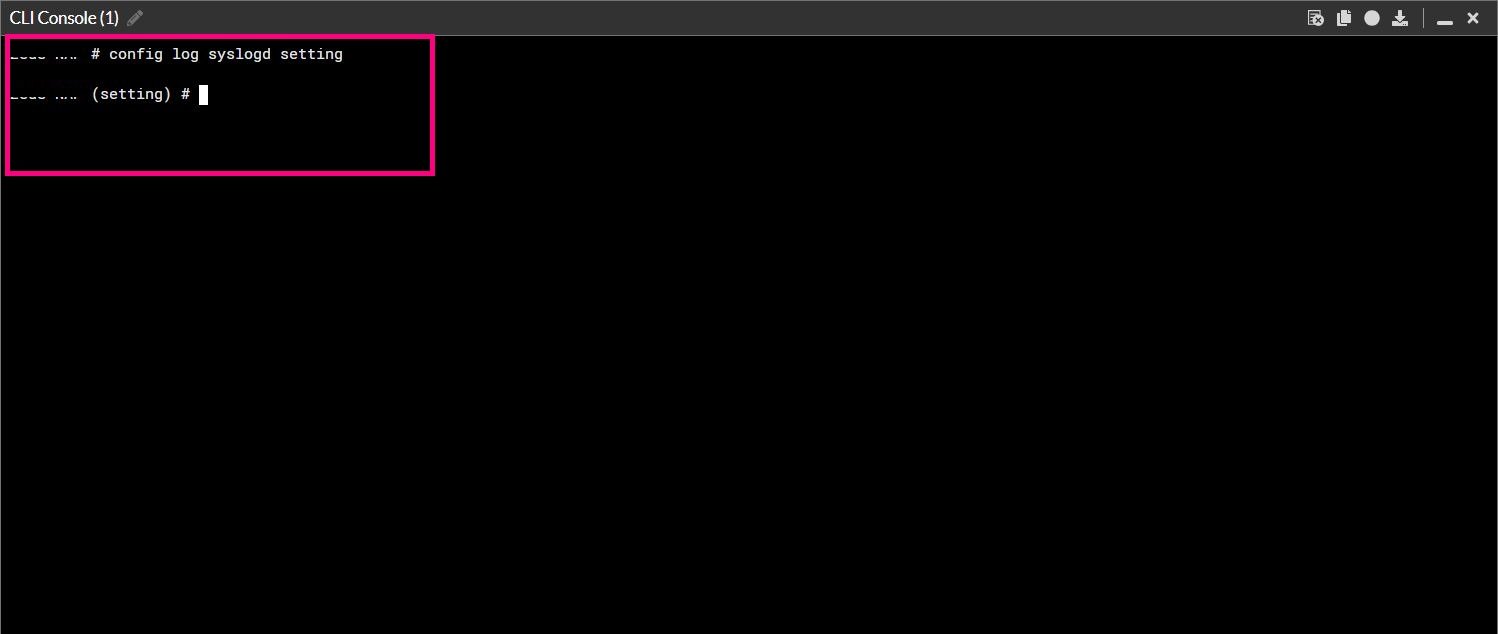


After setting up the port and saving the configuration, we have completed the setup on the equipment side.
6. Once we have completed this configuration, the next step is to navigate to Elasticsearch and proceed with the integration with Elastic Agent.


7. Now, we proceed to the “Add Integrations” section and search for the one we need, in this case, “Fortinet FortiGate Firewall Logs”.

8. Next, we select the “Add Fortinet Fortigate Firewall Logs” option.

9.Next, we give the integration a name and proceed with the configuration. Here, we enter the collector's IP address, which in our case is 192.168.10.2, and the port we defined earlier as 3623 in the FortiGate firewall. Since our port is UDP, we select this option. Then, we add a tag named “fortinet-infrasecuritycode”.


10. To complete this configuration, simply click on the “Save and deploy changes” option.

11. Now, let's go to the policy we created called “Colector-Infrasecuritycode”, where we added the integration. If you want to learn more about policies and integrations, I invite you to read this article.

12. To conclude, now we head to “Discover” and visualize the collected logs.


In this article, we have explored the importance of integrating the FortiGate Firewall with Elasticsearch to enhance our security and improve event management. We have also understood that this integration enables us to gain a comprehensive view of our security posture, take proactive measures, and streamline security incident investigation.
Stay tuned for future contents. Don't miss out!

Hi! I am Kendra Mazara
Senior Information Security Specialist | MBA | Cofounder MujeresTICs RD | Speaker | LinkedIn Learning Instructor