
Elasticsearch Alert Configuration

After delving into everything related to Elastic Agent policies and integrations, which you can read about here, and in the previous article where we explored the integration of a remote device (Fortigate) through a collector, let's see what comes next.
Well, after collecting logs from important data sources, we will define rules that will alert us in case of an anomaly or a specific event that we have defined.
Here, I'll define what an alert is... Think of it as an urgent notification you receive when something you've defined as important happens. It can be a single event or a series of specific events. This notification is sent directly to the responsible individuals or teams who can take immediate action. This is what we know as alerts, which can reach you through email, Slack, Teams, or any other means that suits your needs or where you feel most comfortable.
However, there's an important detail that all cybersecurity professionals need to consider: "alert fatigue." This occurs when we face a high volume of security alerts, which can result in decreased productivity due to stress and overload. In some cases, we may even overlook real threats due to the overwhelming number of notifications. Why does this happen? Primarily because we don't effectively and consistently manage the tuning of these alerts, nor do we properly prioritize the root causes that trigger them.
In the next steps, I will show you how to set up rules in Elasticsearch using the logs we collect. In this case, we will configure a rule that sends us notifications for a specific Windows event through the Microsoft Teams tool.
Let's get started!
To ensure that alert notifications reach Teams, it's essential to establish the connection between Elasticsearch and this Microsoft application.
To achieve this integration, we will follow the following steps:
We access Elasticsearch to carry out the necessary configurations.

2. Now, we head to “Stack Management” and then to “Connectors” to create the connector that will link Elasticsearch with Teams.


3. Next, we create the connector, select “Microsoft Teams,” and assign it the name “Infrasecuritycode Teams”.


4. Next, we head to the “Microsoft Teams” application to create the Webhook URL, which allows external applications to share content with Teams. To do this, within applications, we search for “Incoming Webhook” and select the “add” option.

5. Now, we will proceed to include the “Infrasecuritycode” team and then select the “Set up a connector” option.


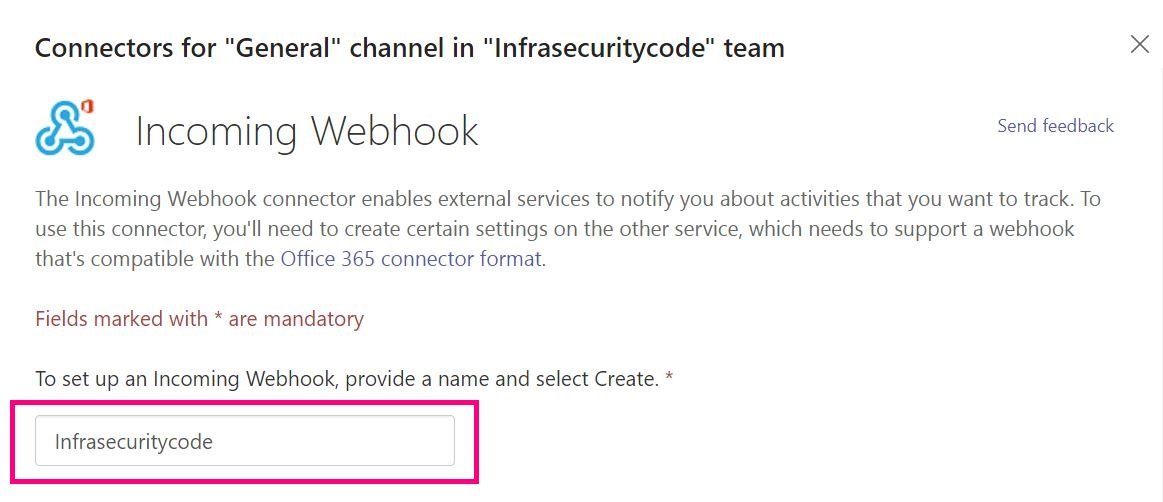
6. Next, we choose “Configure”in “Incoming Webhook”, assign it the name “Infrasecuritycode,” and finally, click on “Create”.


7. Now, we will copy the link and, finally, select the “Done” option.

8. Next, we return to Elasticsearch, paste the link we created in the '“Webhook URL” section, and finally, select “Save & test” to perform a test.

9. Next, we proceed to perform the test to confirm if we are already receiving alerts in Teams.

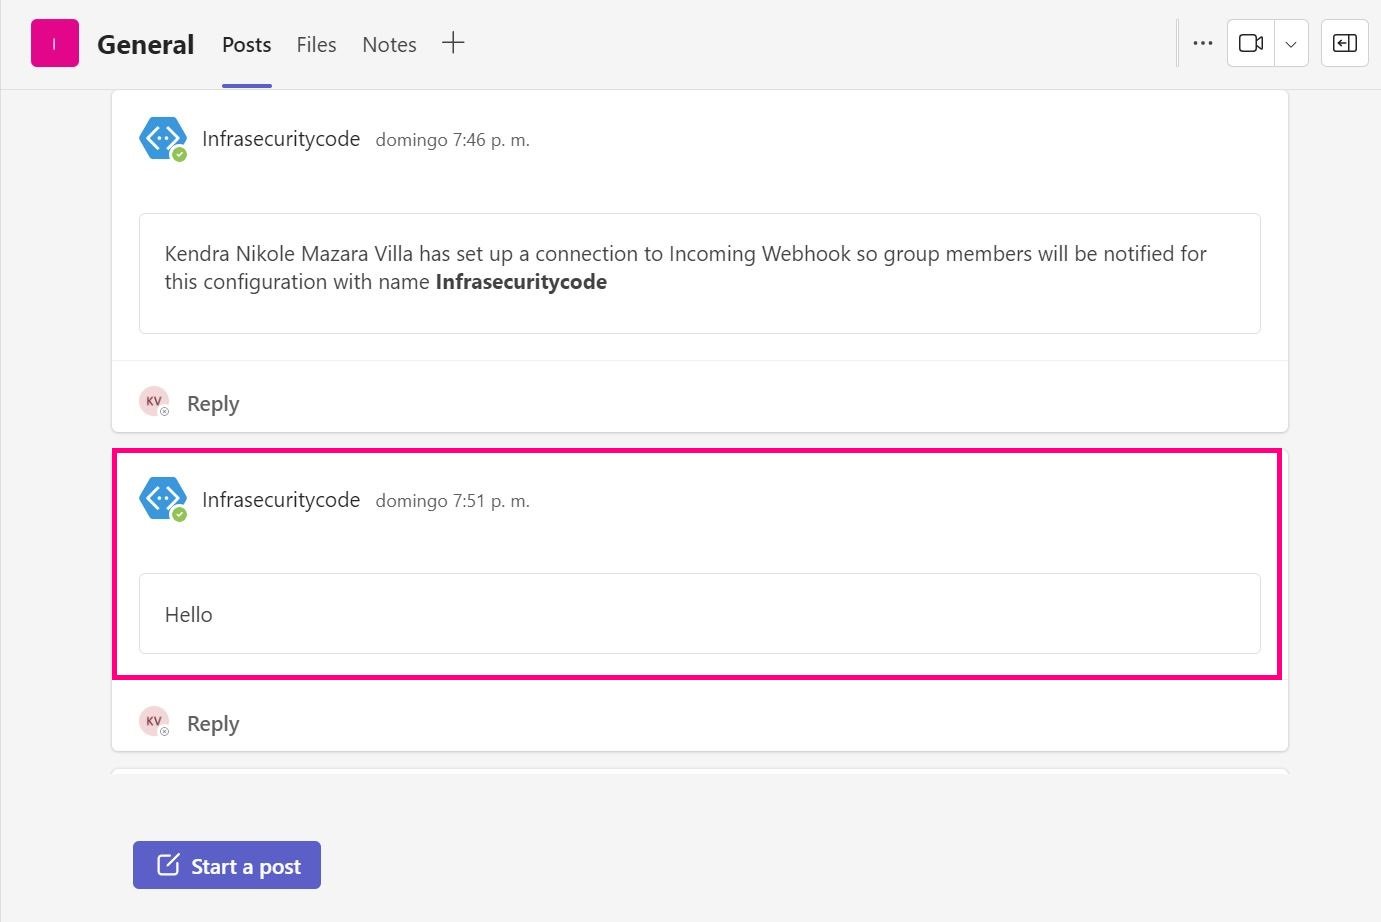
10. Finally, we head to Teams and confirm that we have received the test alert
Now, we will proceed with creating a rule based on “Windows Events.” We will set up a rule so that we can receive alert notifications in the event of failed login attempts.
11. Returning to Elasticsearch, we navigate to “Rules” located in the Security section.

12. We select “Create new rule” and opt for “Custom query”.


This type of rule provides users with the ability to create alerts based on custom queries. These queries are essential for anomaly detection, threat identification, and security incident response.
13. We will proceed to configure the rule. In the “Index Patterns” section, we leave the “logs” index selected because that's where the events we are using arrive. Then, in the “Custom Query” option, we filter the necessary data.


14. Now, we select the option "Continue," then, we assign a name "Event ID 4625 - Failed Login Attempt," a description to the rule, and also specify the severity, in this case, we select the "High" level.

15. Continuing with the configuration, we add a tag named “Infrasecuritycode,” then select the “Schedule” and set up the query to run every one minute


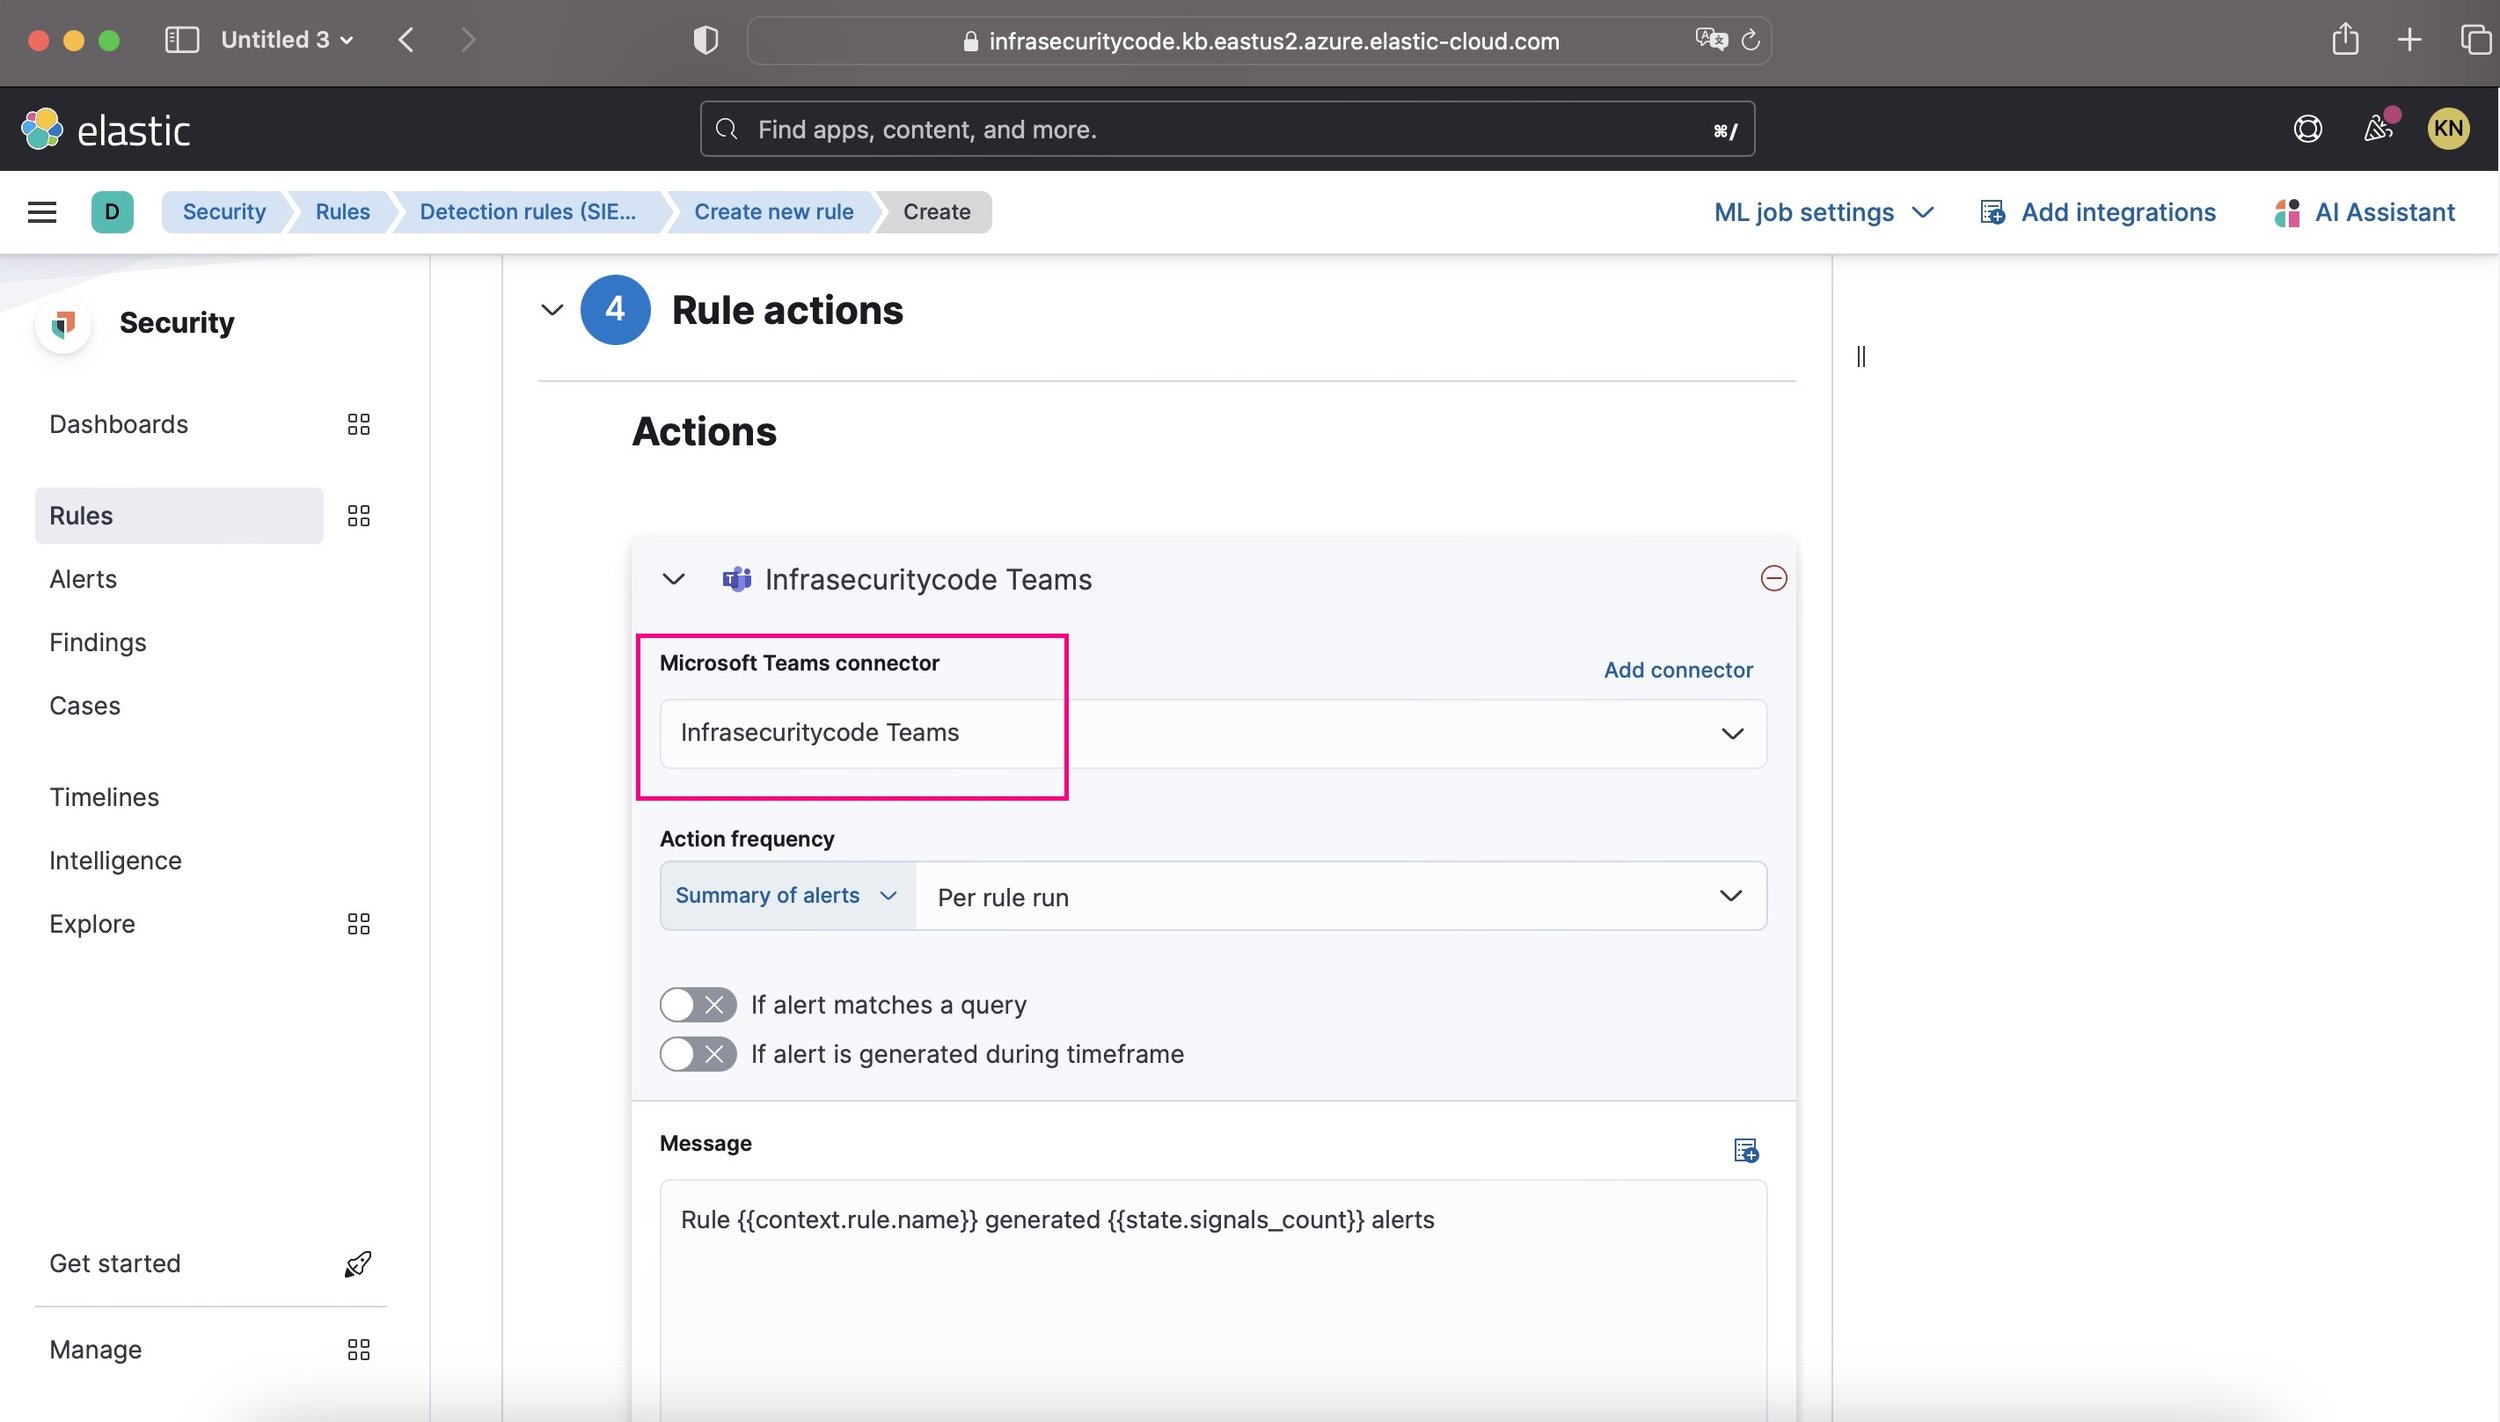
16. After selecting “Continue” choose the connector type, which is “Microsoft Teams,” and select the connector we created, named “Infrasecuritycode Teams.” Finally, click on the “Create & Enable Rule” option to complete.


View summary of the created rule.

17. To finish, we generate event logs to receive this alert in Teams. We carry out six failed login attempts on the Windows Server 2022. Then, we navigate to the “Alerts” section within the Security section to confirm that the alerts are being generated. Afterward, we access the Teams application to view the notifications for the generated alerts.


Alright, we have completed the configuration. I hope it has been useful for you. Keep in mind that this setup is basic, but you can add various conditions and other types of rules according to your needs. Later on, I will show you more about other types of alerts.
Stay tuned for future contents. Don't miss out!

Hi! I am Kendra Mazara
Senior Information Security Specialist | MBA | Cofounder MujeresTICs RD | Speaker | LinkedIn Learning Instructor