
Elastic Agent - Policies and Integrations

In the previous article, we started our journey to understand Elastic Agent from scratch. In that first chapter, we focused into the fundamental aspects of this tool. This time, we are going to dive even deeper into the world of Elastic Agent by exploring the policies and integrations it offers in detail.
Elastic Agent policies are a set of predefined configurations that determine what types of data should be collected and how they should be collected. This encompasses aspects like metrics, logs, and other relevant data for system monitoring and management. It's crucial to understand that these policies can be assigned to groups of agents or specific teams, providing the necessary flexibility to customize the configuration according to the needs of each particular group.
To better grasp this concept, let's consider a practical example. Suppose you're in charge of managing a server network that includes both mail servers and web servers. Each type of server generates different data and requires a specific monitoring approach. This is where Elastic Agent policies come into play. You can establish a different log collection policy for mail servers compared to web servers. This way, you ensure that data collection is accurate and tailored to the specific needs of each server group.
Now, let's talk about integrations, another key component of Elastic Agent. These integrations are preconfigured modules that greatly simplify data collection from a variety of sources, such as operating systems, cloud services (like AWS and Azure), applications (like Apache and Nginx), and many other sources.
What's noteworthy about integrations is that they come with default configurations that work in most cases. This means you can start collecting data immediately without wasting time on complex setups. Additionally, you have the ability to customize these integrations to your specific needs, allowing you to define what data to collect, where to send it, and how to process it according to your individual requirements.
Let's take a practical example with a Windows Server 2022. This time, we're going to create a policy and add the Windows integration to collect the relevant logs.
1.We start by accessing Elasticsearch, then we proceed to Fleet to create the policy.

2. In Fleet, we navigate to “Agent policies” and create a policy that we name “infrasecuritycode".


3. Here we have the policy we've created.

4. Now, we will proceed to add the integration to the created policy. As you can see, the “system” integration is automatically included in the policy and is designed to collect application, system, and security events on Windows systems.


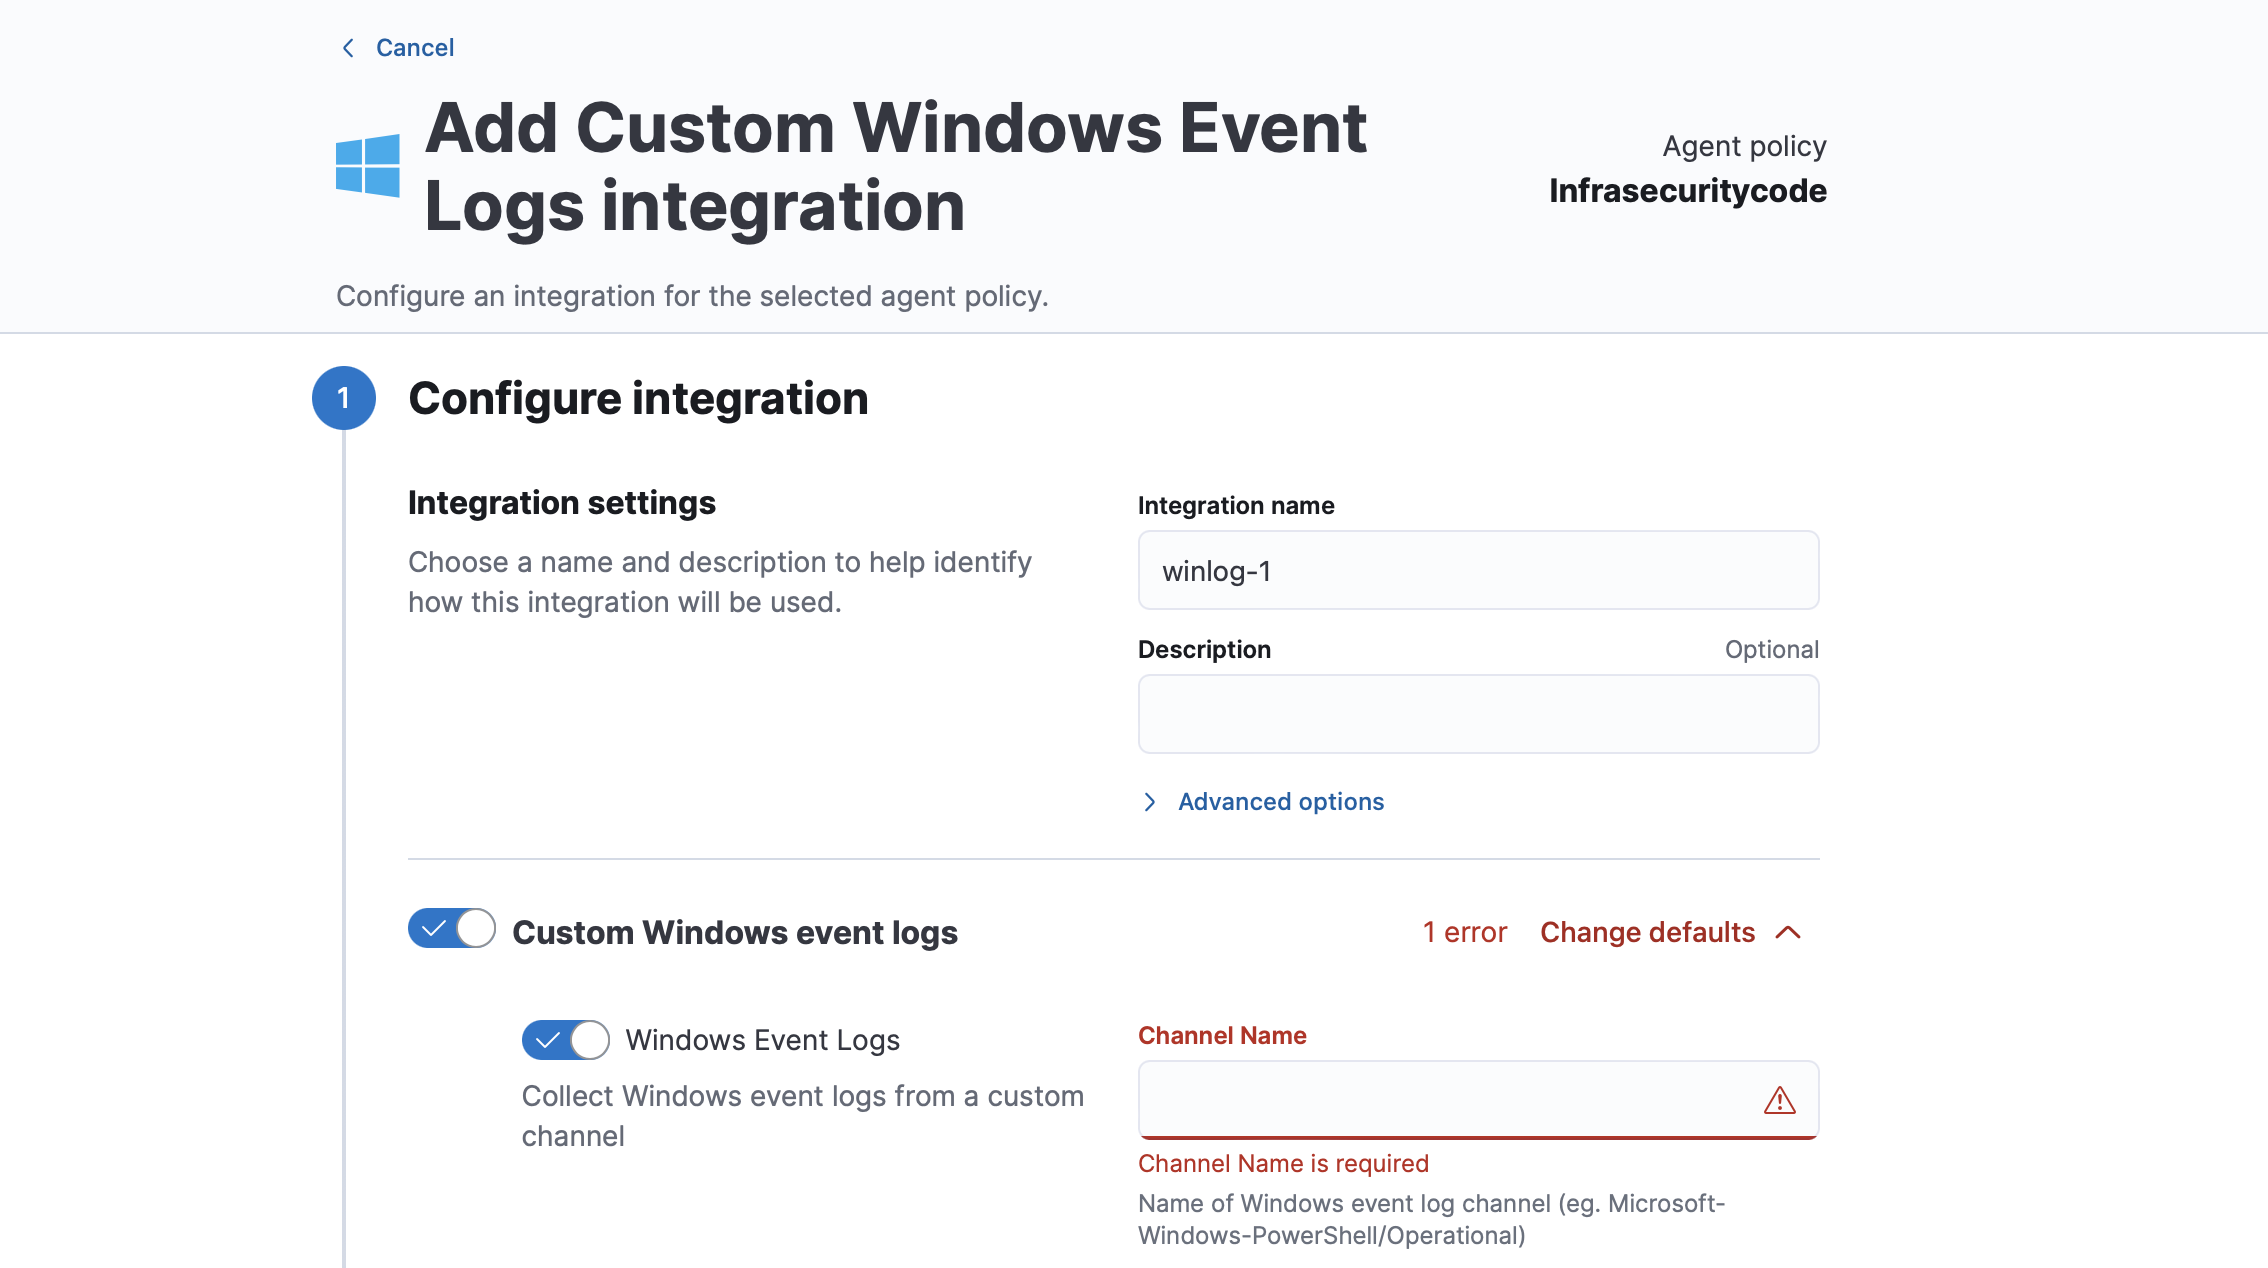
5. At this point, we will proceed to add the Windows integration, specifically selecting “Custom Windows Event Logs”. This integration will allow us to collect events from any Windows Event Log channel. In this case, we will be collecting logs from the Windows firewall.

6.We access the server, and in PowerShell, we run the following command: Get-WinEvent -ListLog * | Format-List -Property LogName to obtain a list of available event log channels.


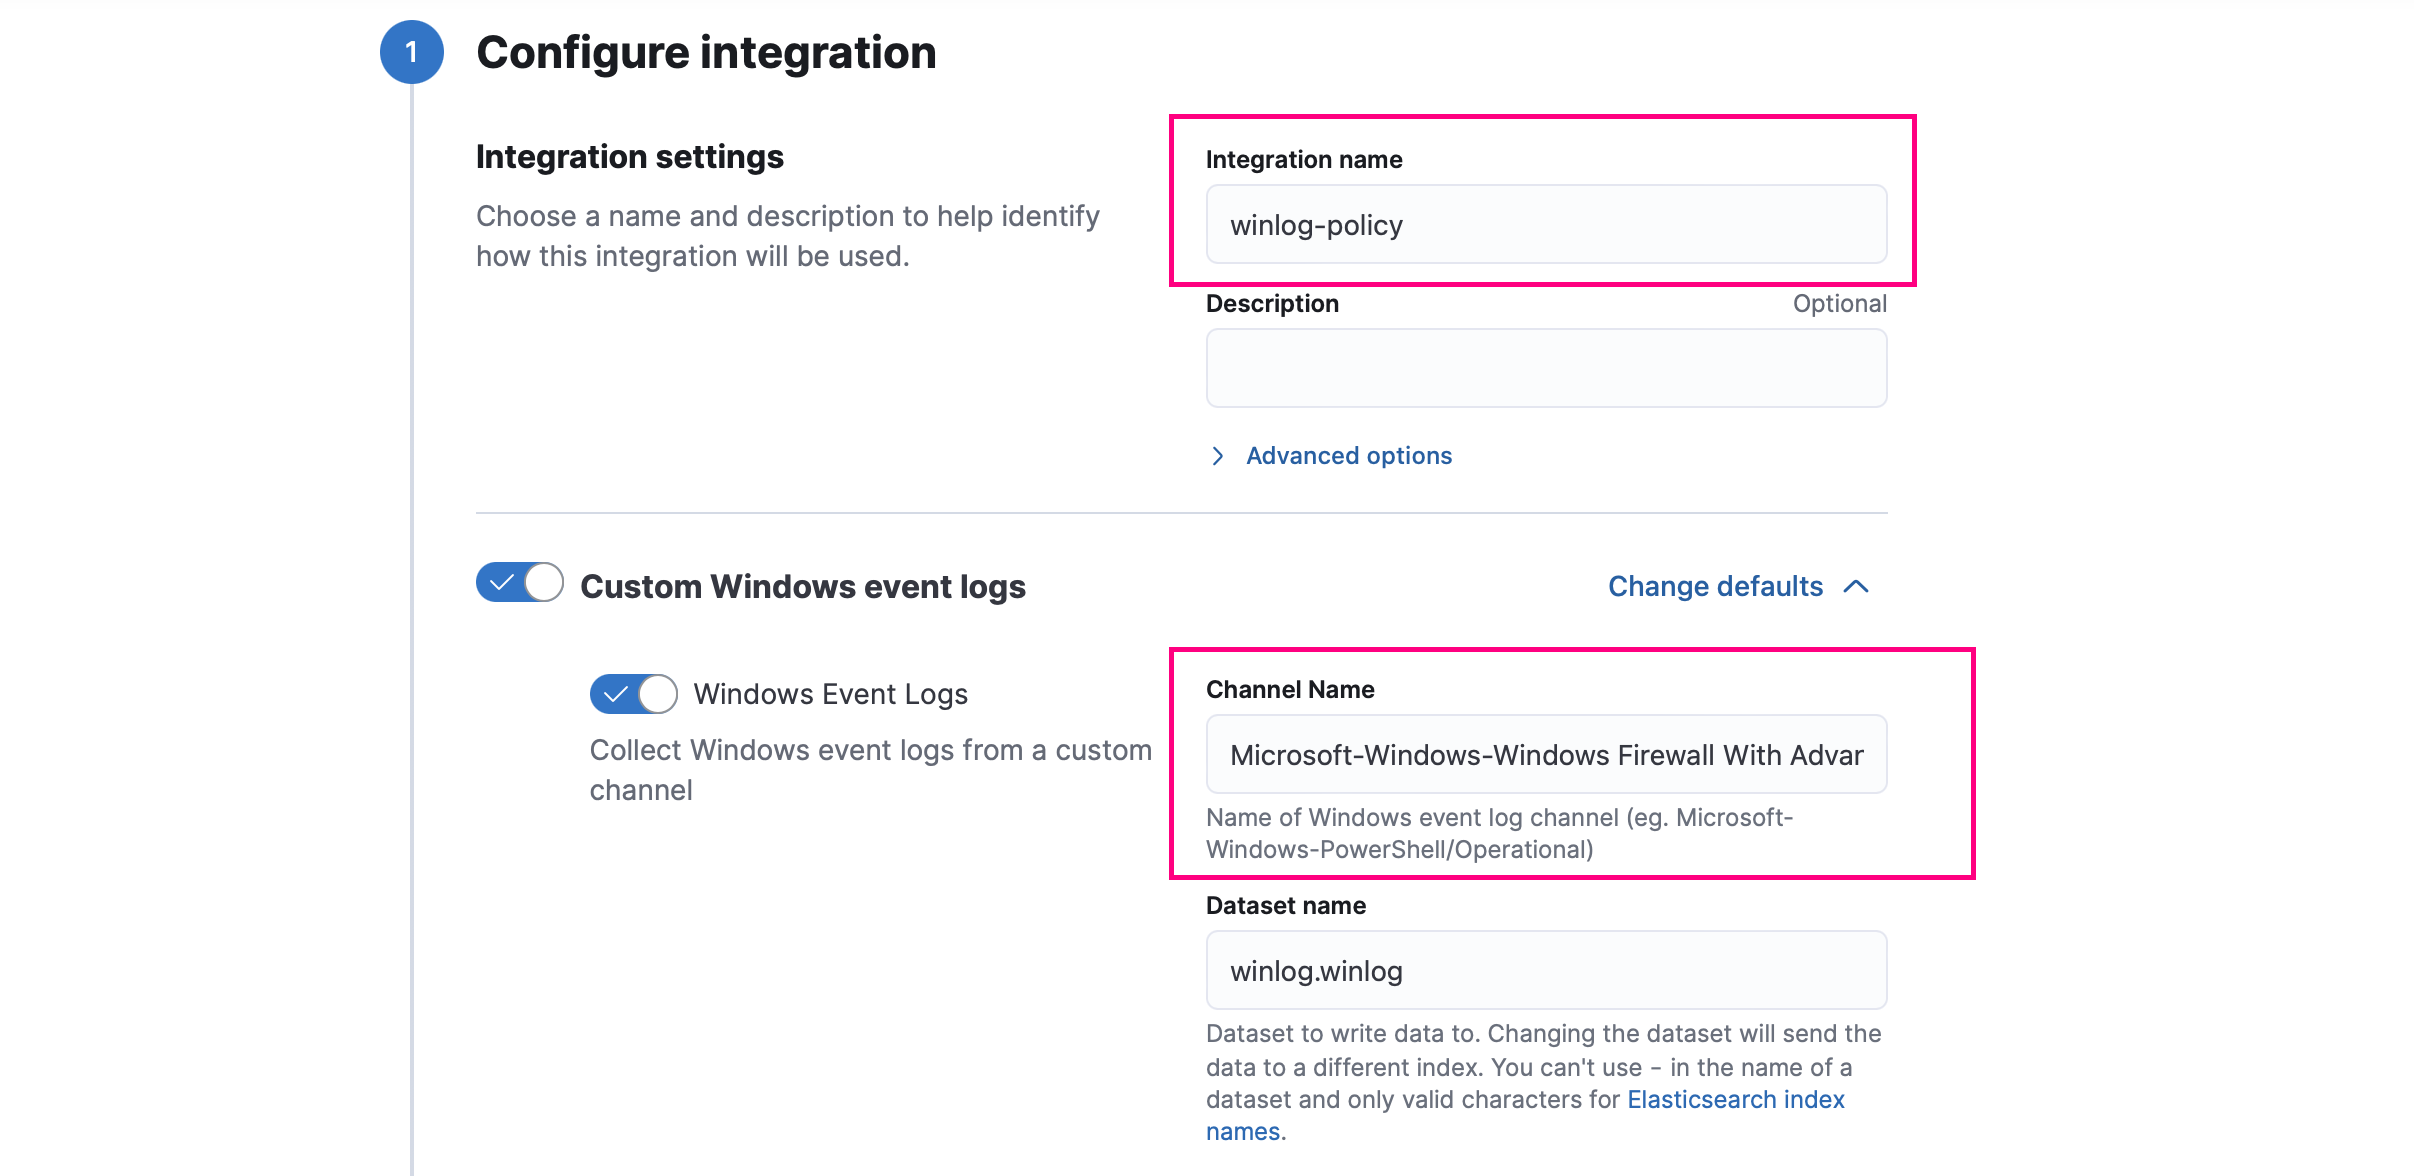
7. We name the integration and add the “Microsoft-Windows-Windows Firewall With Advanced Security/Firewall' channel".


8. We will proceed to assign the policy to the Windows 2022 server agent. First, we install the Elastic Agent on the server using the policy we've created, named “infrasecuritycode”. Follow the same steps as described in the previous article.

Afterward, we access the “Discover” section to visualize the logs or records collected through the “system” and “Custom Windows Event Logs” integrations.
9. We will begin our exploration using the logs collected from the “System” integration to identify Windows events. This time, we will focus on identifying the following Event IDs.
Event ID 4624 - when Event ID 4624 is logged, it means that a successful logon has occurred on an account. In this example, we logged into the test server using an administrator account.

Here we can see the logs

Event ID 4672 - can detect user logins with administrator-level privileges.

Event ID 4625 - failed login attempt

Here, we can see the logs.

Event ID 4798: Windows logs this event when a process enumerates the local groups to which the specified user belongs on that computer. For this example, we executed the “net user” command on the server.


We can view the logs here.


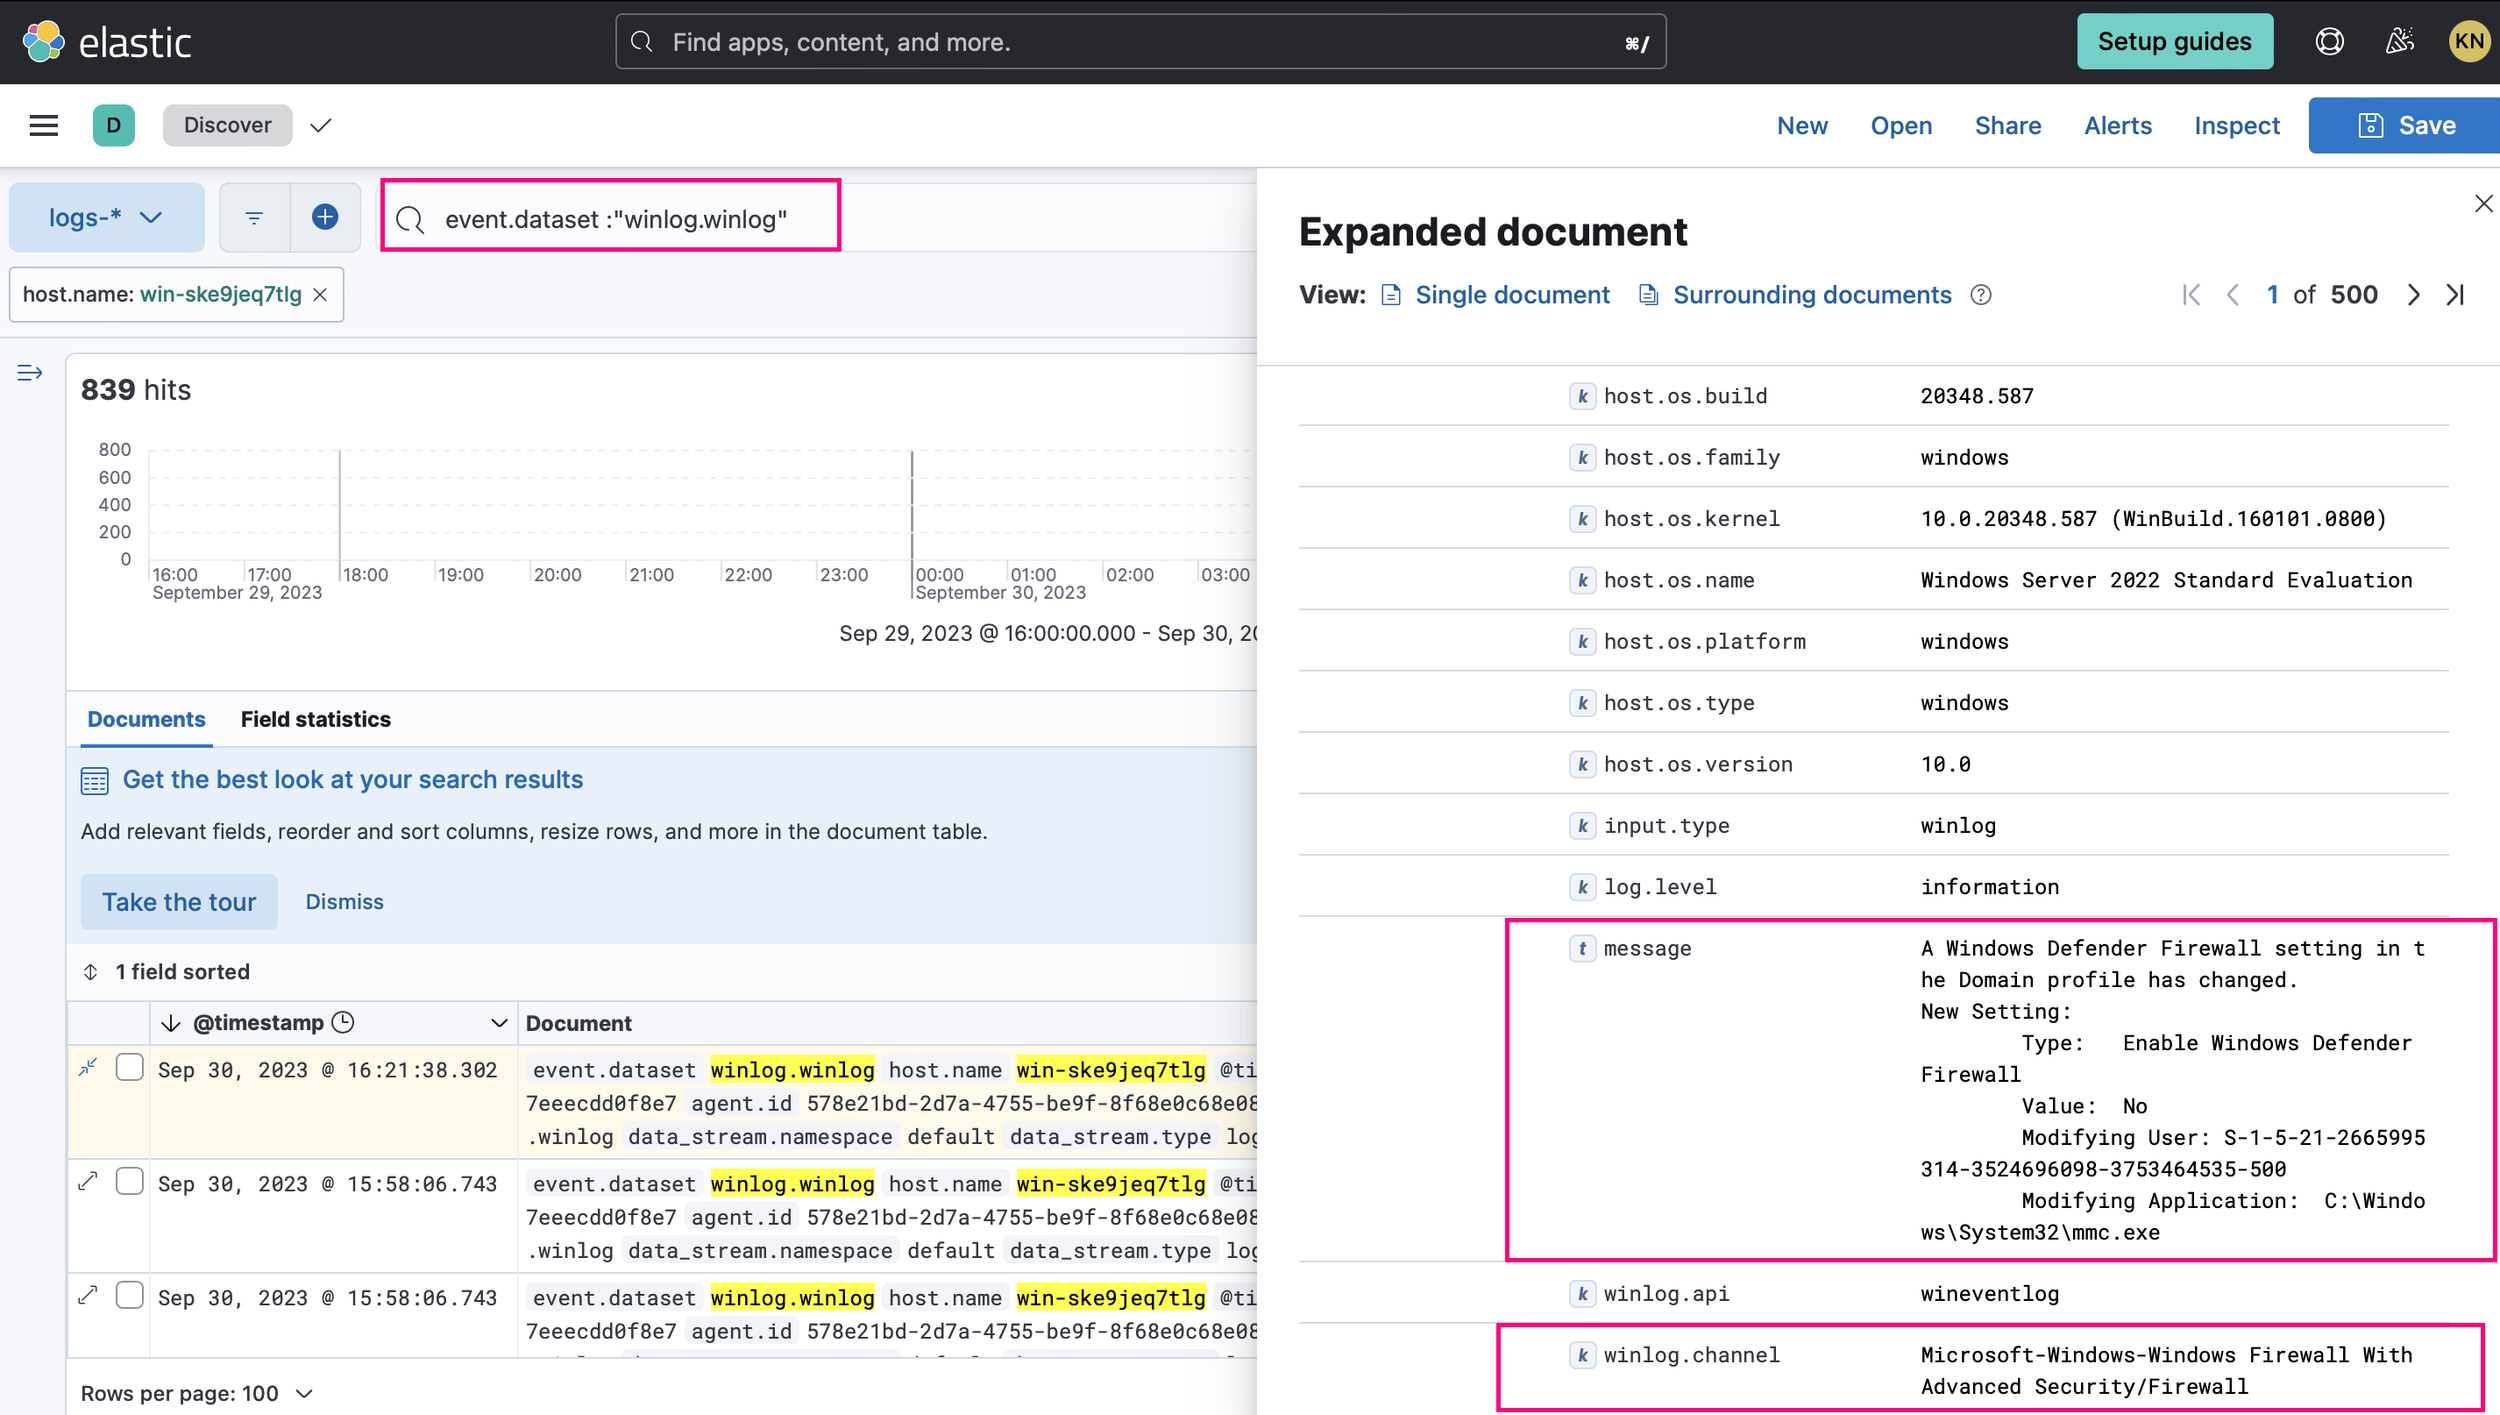
10. Now, we proceed with the logs collected from the “Custom Windows Event Logs” integration. For this example, we'll take a look at the Windows firewall records.

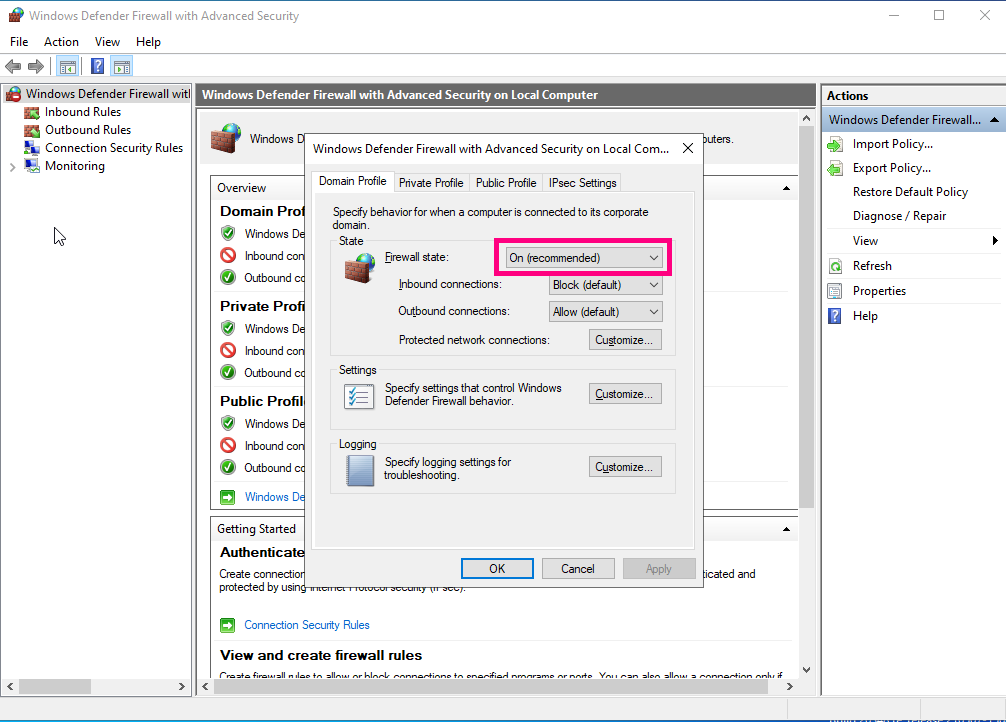
We're going to disable the Windows firewall.

Here, we can see the logs.
Now, let's re-enable it.
Here, we can see the logs.

¡Done! We conclude here.
I hope that this article has provided you with valuable tools for effective monitoring of your infrastructure and enhancing the security of your systems. By improving the management of critical events, you will gain greater control over your systems, enabling you to keep them secure and operating efficiently with a strong knowledge in these areas.
Stay tuned for future contents. Don't miss out!

Hi! I am Kendra Mazara
Senior Information Security Specialist | MBA | Cofounder MujeresTICs RD | Speaker | LinkedIn Learning Instructor