
What is Elastic Agent, and how does it work?

Have you heard of Elastic Agent? If you're interested in efficient monitoring and management of your systems and devices, you're in the right place. In this article, I provide a comprehensive overview of what it is and how it works. I'll also guide you through its various facets, offering valuable tips and best practices for effective implementation. Additionally, you'll find a detailed demonstration of how to configure it step by step. Whether you're an experienced system administrator or a newcomer to the world of infrastructure monitoring and security, this is for you.
Elastic Agent has become a crucial tool for log and metric collection, but that's not its only functionality. This agent also offers the ability to gather information from operating systems and strengthen the security of your devices (endpoints) against potential threats. Furthermore, its management is carried out through the Fleet application in Kibana, allowing you to centralize policies and effectively add integrations with other services through a collector server.
If you're just starting to explore this tool with the intention of implementing it, I'll introduce three key aspects to consider:
Identifying the devices to monitor: First, it's essential to know which remote devices you want to monitor, whether they are firewalls, intrusion detection and prevention systems (IDPS), Web Application Firewalls (WAF), or other devices. Additionally, you must determine the protocol through which you can collect these logs, such as Syslog.
Preparing the integration or collector device: Once you know what data sources you want to monitor, you need a dedicated device to install Elastic Agent and then add the necessary integrations.
Monitoring servers and endpoints: If you want to monitor not only remote devices but also servers or endpoints in your infrastructure, whether they are Windows, Linux, or MacOS systems, you can achieve this through specific integrations that I will discuss later.
It's crucial to have a good understanding of the infrastructure environment you want to monitor and protect, especially if you're in the process of implementing a Security Operations Center (SOC). If that's your situation, I encourage you to read the article I've written on the topic.
Now, let's take a step-by-step look at how to practically visualize this process. This time, we'll configure Elastic Agent on a Mac computer to collect logs.
We'll start from scratch by creating a small cluster in the cloud, and in this case, we'll set it up on Elastic Cloud.
1. After accessing Elastic Cloud, click on the “Create deployment” option to proceed.

2. Next, enter a name for the cluster (you can choose any name you prefer). In my case, I chose to name it “Infrasecuritycode”.

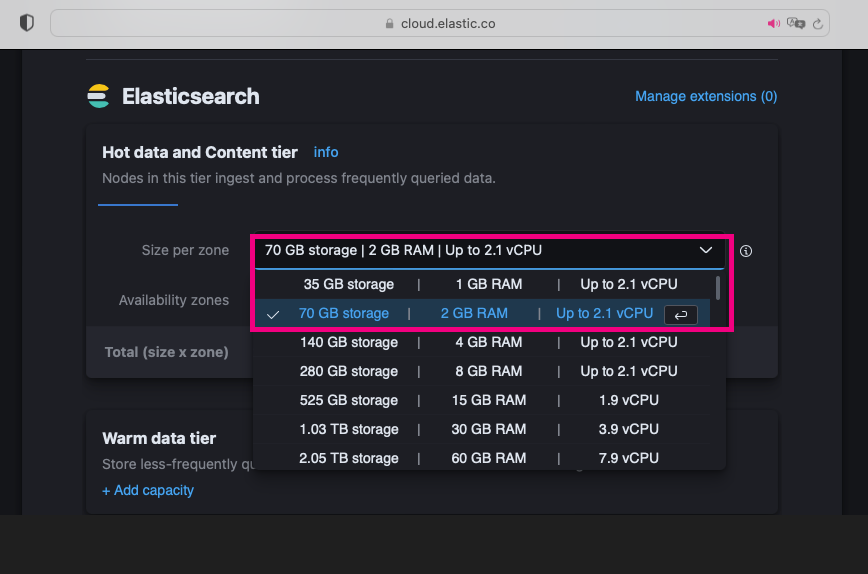
3. Now, let's choose the storage capacities for the Elasticsearch cluster, Kibana, Integration Server, and Enterprise Search. For testing and example purposes, we recommend using minimum capacities.


4. After this, click on “Create deployment” to initiate the deployment.

5. At this point, you can download the credentials for the cluster. Be sure to securely save this information!

6. Perfect! We've completed the creation of our cluster. Now, simply click on the “Continue” option.

Now, we access Elasticsearch, and we will proceed with the installation of Elastic Agent to monitor a Mac computer.

7. We select the “Fleet“ option to manage communication with Elastic agents.

8. To proceed, we select “Add agent”, then click on “Create new agent policy,”, and leave the option recommended by Elastic.


9. Here, we choose the “Mac” option and copy the provided commands.

Now, we navigate to the Mac computer where we want to install the agent.
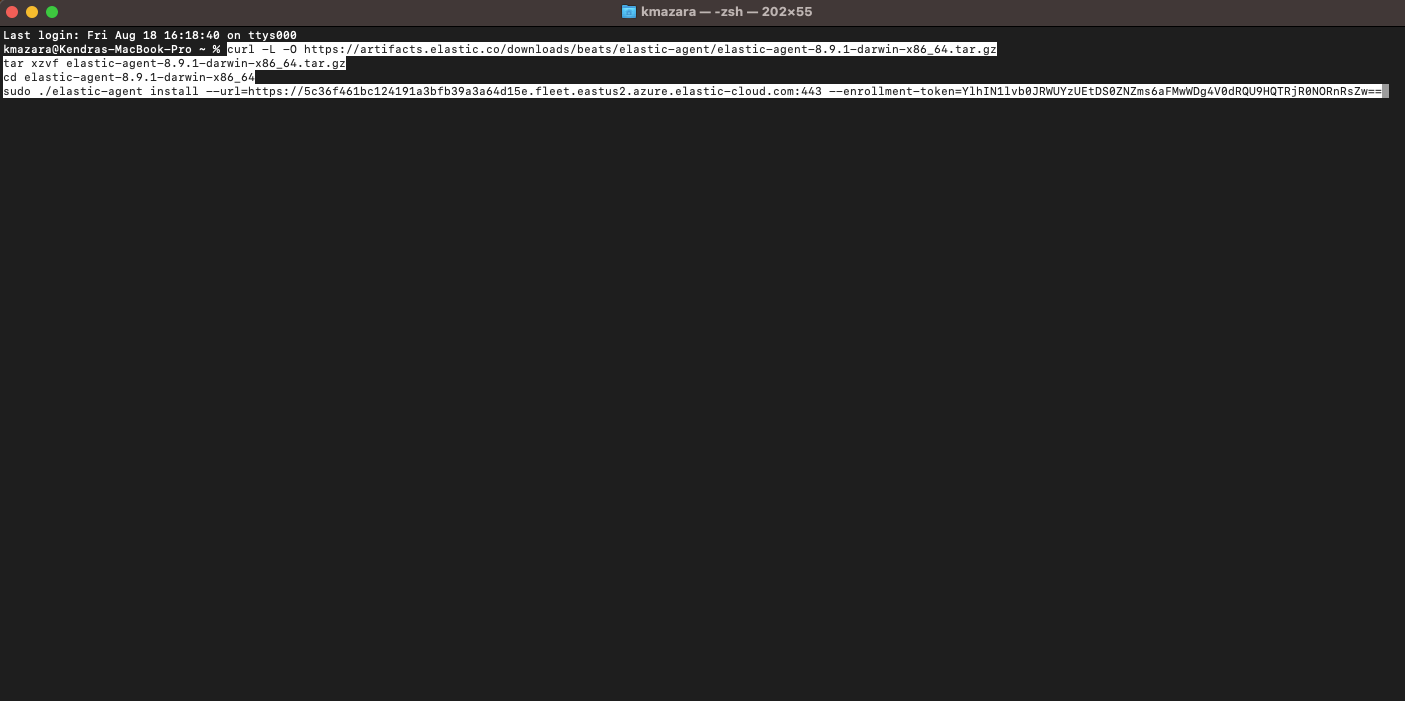
10. We open the terminal and paste the commands that we copied in the previous step.

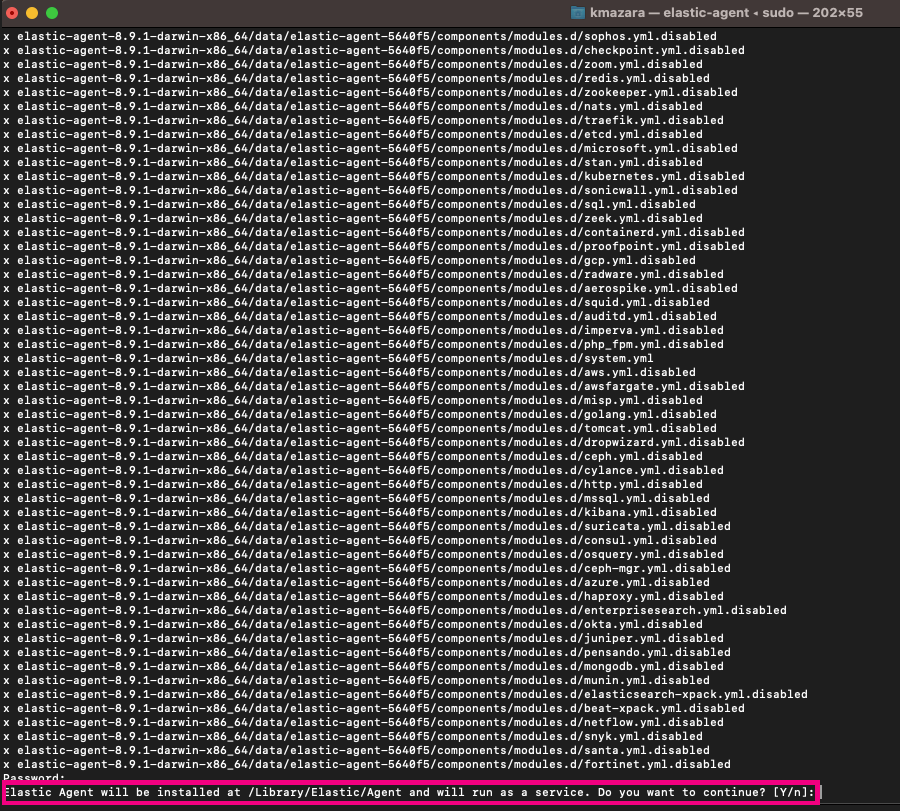
11. Next, we enter "Y" to accept the agent being installed and run as a service. With this, the installation will begin.

On the Fleet side, we can monitor the status of the agent installation.

As you can see, the Mac computer we integrated in the previous steps now appears in the list of Agents, with the agent installed and the default policy assigned.

12. Finally, we go to the "Discover" section, and now we can view the logs!

Here are the logs.


Up to this point, we have explored the fundamental concepts of Elastic Agent. In the upcoming releases, we will delve into topics related to the creation and assignment of monitoring policies, essential concepts to enhance your experience with Elastic Agent.
I invite you to stay tuned for future content. Don't miss out!

Hi! I am Kendra Mazara
Senior Information Security Specialist | MBA | Cofounder MujeresTICs RD | Speaker | LinkedIn Learning Instructor